- 分析
- 技术分析
香港股指 技术分析 - 香港股指 交易: 2025-04-01
香港股指 技术分析总结
低于 22907.0
Sell Stop
高于 23868.4
Stop Loss

指标 | 信号 |
RSI | 中和 |
MACD | 卖出 |
Donchian Channel | 中和 |
MA(200) | 买进 |
Fractals | 卖出 |
Parabolic SAR | 卖出 |
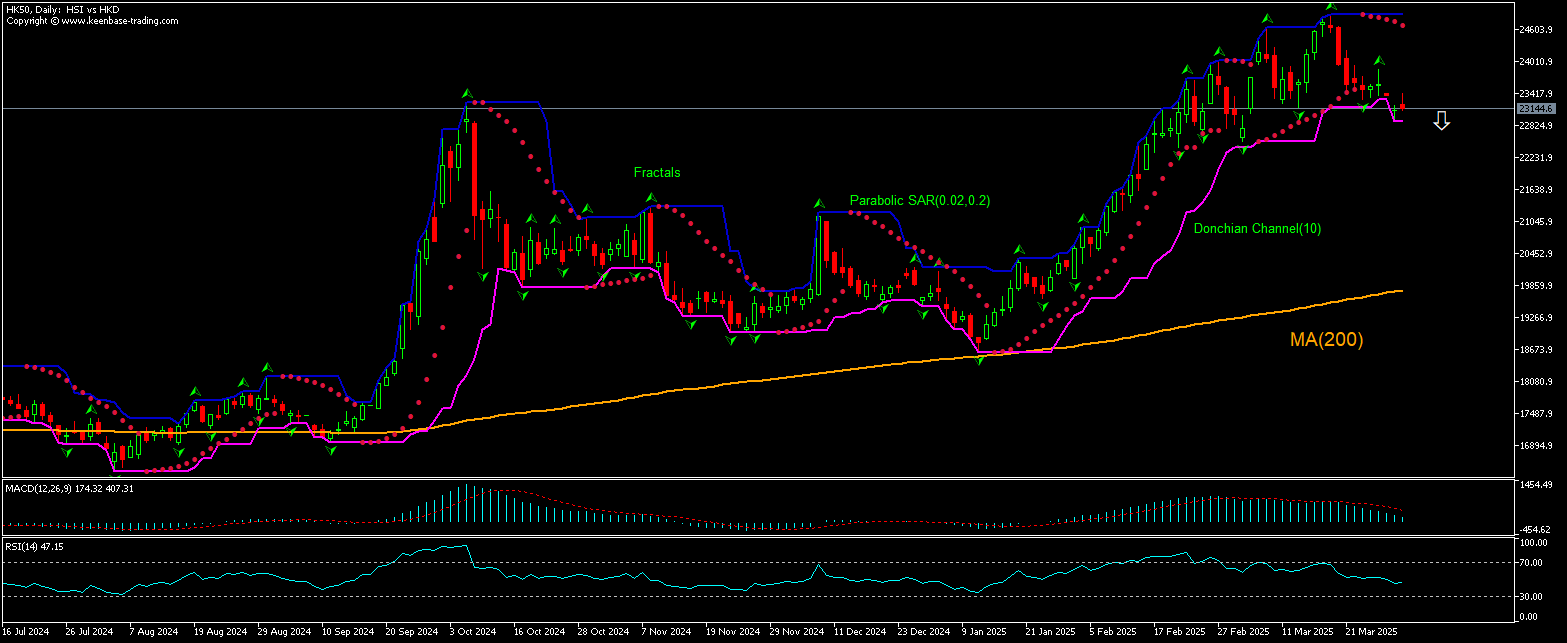
香港股指 图表分析
香港股指 技术分析
The HK50 technical analysis of the price chart in daily timeframe shows HK50,Daily is retracing down toward the 200-day moving average MA(200) after rebounding to 35-month high two weeks ago. We believe the bearish momentum will continue after the price breaches below the lower Donchian boundary at 22907.0. This level can be used as an entry point for placing a pending order to sell. The stop loss can be placed above 23868.4. After placing the pending order the stop loss is to be moved every day to the next fractal high , following Parabolic signals. Thus, we are changing the expected profit/loss ratio to the breakeven point. If the price meets the stop-loss level (23868.4) without reaching the order (22907.0) we recommend cancelling the order: the market sustains internal changes which were not taken into account.
指数 基本面分析 - 香港股指
Hong Kong retail sales decline continued in February. Will the HK50 retreating continue?
Recent Hong Kong retail sales data were negative for Hong Kong economy: retail sales in Hong Kong fell 15% over year in February, accelerating the decline from a downwardly revised 5.1% drop in January. It was the sharpest drop since April 2024 in the row of twelve straight months of falling. Sales fell in all product categories, including food, clothing and footwear, fuel and consumer durable goods. At the same time retail sales plunged 17.3% over month in February, reversing an upwardly revised 8.2% growth in January. Continuing weakness in retail activity is bearish for HK50 index price.
附注:
本文针对宣传和教育, 是免费读物. 文中所包含的信息来自于公共渠道. 不保障信息的完整性和准确性. 部分文章不会更新. 所有的信息, 包括观点, 指数, 图表等等仅用于介绍, 不能用于财务意见和建议. 所有的文字以及图表不能作为交易的建议. IFC Markets及员工在任何情况下不会对读者在阅读文章中或之后采取的行为负责.