- 分析
- 技术分析
USD/NOK 技术分析 - USD/NOK 交易: 2021-05-24
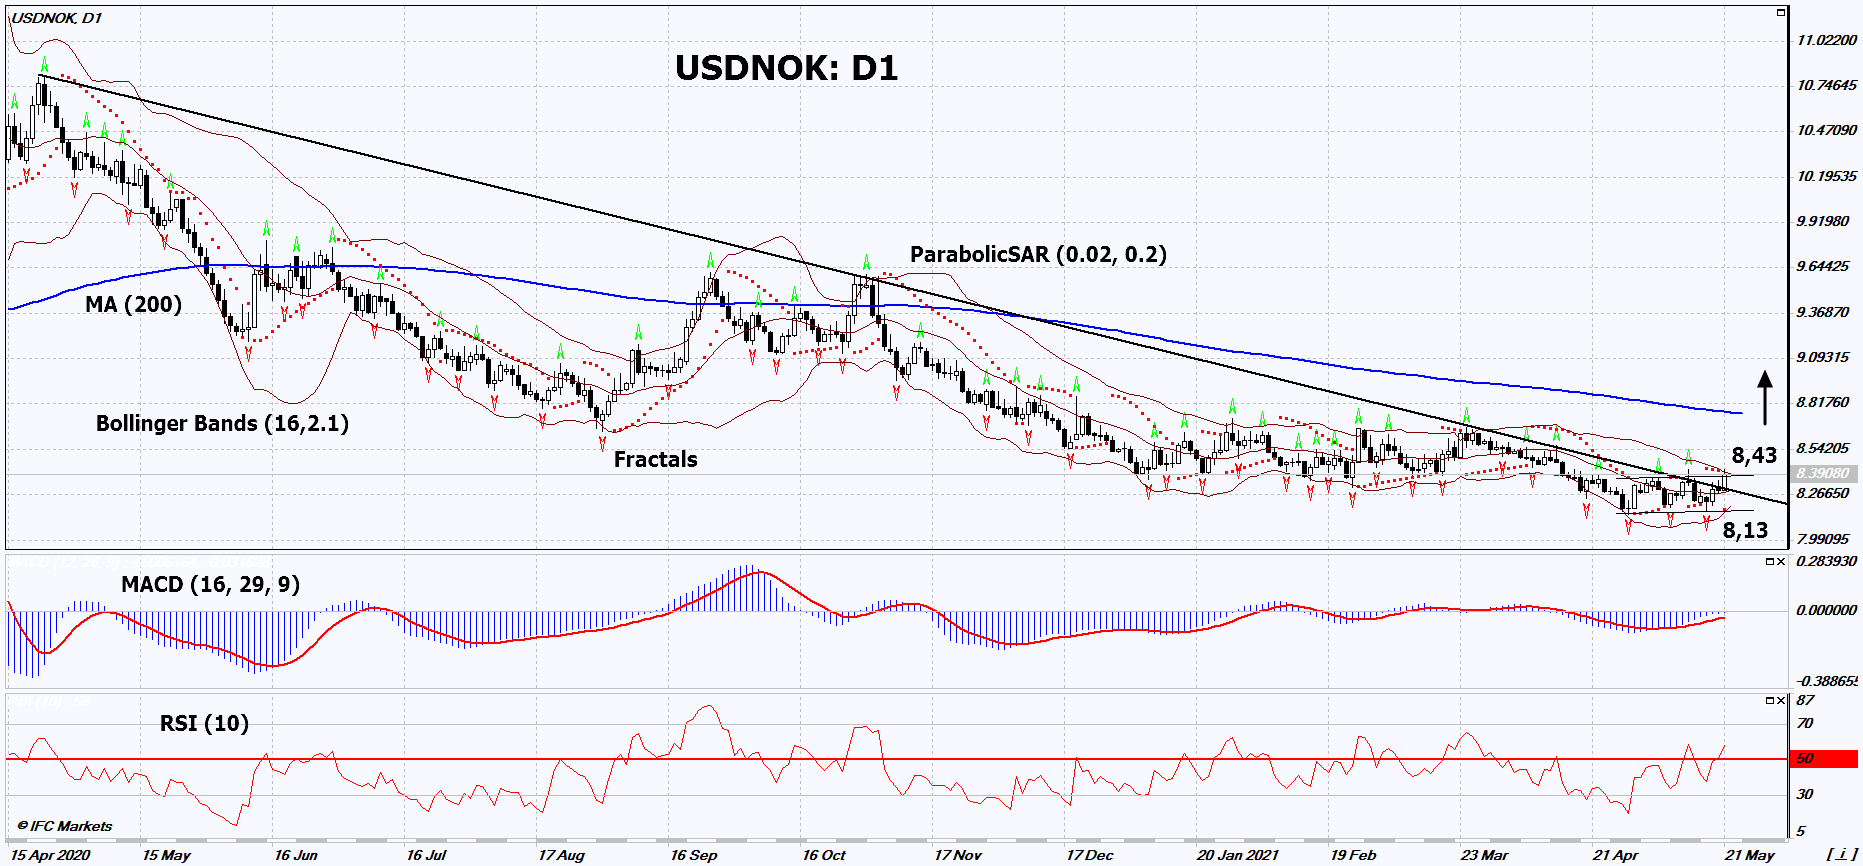
USD/NOK 技术分析总结
高于 8,43
Buy Stop
低于 8,13
Stop Loss
| 指标 | 信号 |
| RSI | 中和 |
| MACD | 买进 |
| MA(200) | 中和 |
| Fractals | 中和 |
| Parabolic SAR | 买进 |
| Bollinger Bands | 中和 |
USD/NOK 图表分析
USD/NOK 技术分析
On the daily timeframe, USDNOK: D1 broke up the resistance line of the long-term downtrend. A number of technical analysis indicators have formed signals for further growth. We do not exclude a bullish movement if USDNOK rises above the last upper fractal and upper Bollinger band: 8.43. This level can be used as an entry point. The initial risk limitation is possible below the Parabolic signal, 3 lower fractals, the minimum since October 2018 and the lower Bollinger band: 8.13. After opening a pending order, we can move the stop-loss to the next fractal low following the Bollinger and Parabolic signals. Thus, we change the potential profit / loss ratio in our favor. After the transaction, the most cautious traders can switch to the four-hour chart and set a stop-loss, moving it in the direction of the trend. If the price overcomes the stop-loss (8.13) without activating the order (8.43), it is recommended to delete the order: there are internal changes in the market that were not taken into account.
外汇交易 基本面分析 - USD/NOK
Weak economic data came out in Norway. Will the USDNOK quotes continue to rise?
An upward movement signifies a weakening of the Norwegian krone against the US dollar. Inflation in Norway has been at a high level for 3 months. In April it was 3% in annual terms. House Price Index in May was 12.3% in annual terms. Meanwhile, since May 2020, the Norwegian Central Bank (Norges Bank) rate is 0%. It is unlikely that index will increase it while macroeconomic indicators remain weak. Norway's foreign trade balance in April amounted to only 17 billion kroner, while the forecast was 20.3 billion kroner. Norwegian GDP in the Q1 of 2021 decreased by 1.4%. This is also worse than expected (-0.6%). Note that the next meeting of Norges Bank will take place on June 17.
附注:
本文针对宣传和教育, 是免费读物. 文中所包含的信息来自于公共渠道. 不保障信息的完整性和准确性. 部分文章不会更新. 所有的信息, 包括观点, 指数, 图表等等仅用于介绍, 不能用于财务意见和建议. 所有的文字以及图表不能作为交易的建议. IFC Markets及员工在任何情况下不会对读者在阅读文章中或之后采取的行为负责.


